Almost four out of five traders are short US dollar against the yen - find out how many times USD/JPY has traded above 150.00 and more historical context for the pair.
Key points
* IG client sentiment shows 78% of traders are short USD/JPY above 145.30
* USD is up over 700 pips from July 13th against Japanese yen
* 150.00, reached late last year, is the highest price for the pair since 1990
USD/JPY price history
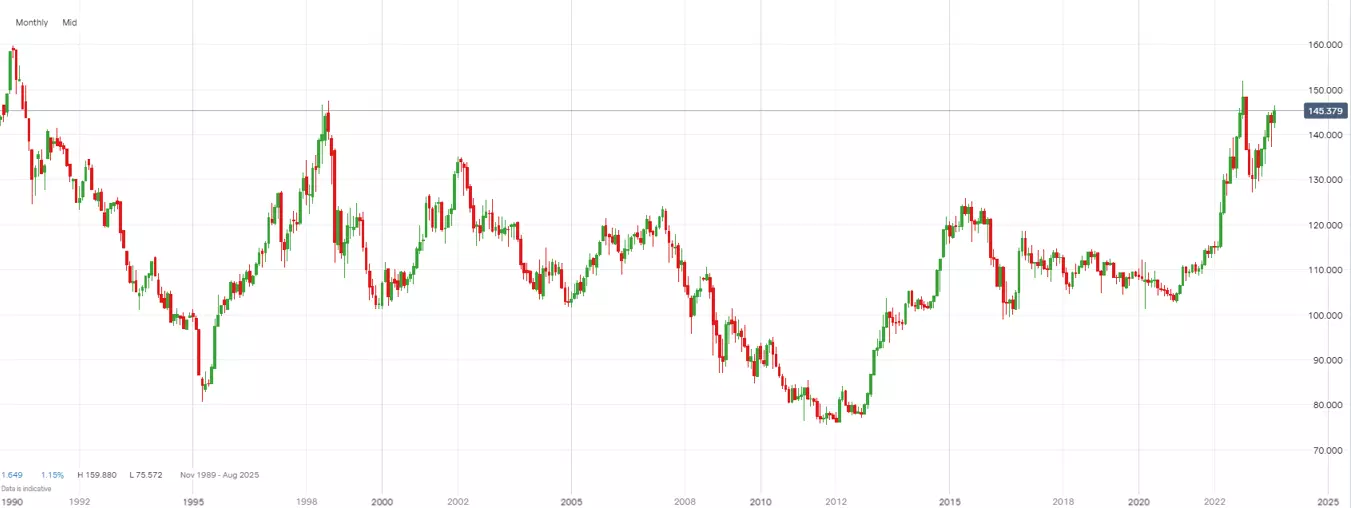
Last week, US dollar hit year-to-date highs against the yen and the pair continues to trade above 145.00 this week. Traders wondering where the ceiling could be for USD/JPY would see historically prices reached 150.36 in October of 2022. Prior to that extreme, the last time above 150.00 was August of 1990.
This summer has been particularly volatile for USD/JPY. Closing above 144.66 on July 3rd, the pair dropped over 700 pips by July 13th. Back above 145.00, USD has regained all of the losses from mid-July and more.
USD/JPY 30-year prices
How to trade USD/JPY
1. Open an account to get started, or practice on a demo account
2. Choose your forex trading platform
3. Open, monitor, and close positions on USD/JPY
Trading forex markets like USD/JPY requires an account with a forex provider like IG. Many traders watch other major forex pairs like EUR/USD and GBP/USD as well for more potential opportunities. You can help develop your forex trading strategies using resources like IG’s Trading Academy.
Once your strategy is developed, you can follow the above steps to opening an account and getting started trading forex.
Your profit or loss is calculated according to your full position size. Leverage will magnify both your profits and losses. It’s important to manage your risks carefully as losses can exceed your deposit. Ensure you understand the risks and benefits associated with trading leveraged products before you start trading with them. Trade using money you’re comfortable losing.
This information has been prepared by IG, a trading name of IG US LLC. This material does not contain a record of our trading prices, or an offer of, or solicitation for, a transaction in any financial instrument. You should not treat any opinion expressed in this material as a specific inducement to make any investment or follow any strategy, but only as an expression of opinion. This material does not consider your investment objectives, financial situation or needs and is not intended as recommendations appropriate for you. No representation or warranty is given as to the accuracy or completeness of the above information. IG accepts no responsibility for any use that may be made of these comments and for any consequences that result. See our Summary Conflicts Policy, available on our website.
The terms and conditions of use set out below (referred to as "FX Blue's Terms"), form a contractual agreement governing FX Blue's relationship with you in relation to your use of this Website (“Agreement”) and you agree to be legally bound by FX Blue's Terms just as if you had signed this Agreement. By using this Website and any Information, you are agreeing to comply with and be bound by FX Blue's Terms, including any revisions that may be made to FX Blue's Terms from time to time. FX Blue reserves the right, in FX Blue's sole discretion, to change, modify, add or remove portions of FX Blue's Terms at any time by posting the revisions on the Website. You should check FX Blue's Terms periodically for changes as by using the Website after FX Blue posts any changes to FX Blue's Terms, you are agreeing to accept those changes, whether or not you have reviewed them, and you waive any right you may have to receive individualised notice of such changes. FX Blue's Terms may be supplemented by additional terms and conditions pertaining to specific content and activities. You agree and understand that such additional terms and conditions are hereby incorporated by reference to FX Blue's Terms. Your continued use of the Website means that you accept any new or modified FX Blue Terms.
 Key points
* IG client sentiment shows 78% of traders are short USD/JPY above 145.30
* USD is up over 700 pips from July 13th against Japanese yen
* 150.00, reached late last year, is the highest price for the pair since 1990
USD/JPY price history
Last week, US dollar hit year-to-date highs against the yen and the pair continues to trade above 145.00 this week. Traders wondering where the ceiling could be for USD/JPY would see historically prices reached 150.36 in October of 2022. Prior to that extreme, the last time above 150.00 was August of 1990.
This summer has been particularly volatile for USD/JPY. Closing above 144.66 on July 3rd, the pair dropped over 700 pips by July 13th. Back above 145.00, USD has regained all of the losses from mid-July and more.
USD/JPY 30-year prices
Key points
* IG client sentiment shows 78% of traders are short USD/JPY above 145.30
* USD is up over 700 pips from July 13th against Japanese yen
* 150.00, reached late last year, is the highest price for the pair since 1990
USD/JPY price history
Last week, US dollar hit year-to-date highs against the yen and the pair continues to trade above 145.00 this week. Traders wondering where the ceiling could be for USD/JPY would see historically prices reached 150.36 in October of 2022. Prior to that extreme, the last time above 150.00 was August of 1990.
This summer has been particularly volatile for USD/JPY. Closing above 144.66 on July 3rd, the pair dropped over 700 pips by July 13th. Back above 145.00, USD has regained all of the losses from mid-July and more.
USD/JPY 30-year prices
 How to trade USD/JPY
1. Open an account to get started, or practice on a demo account
2. Choose your forex trading platform
3. Open, monitor, and close positions on USD/JPY
Trading forex markets like USD/JPY requires an account with a forex provider like IG. Many traders watch other major forex pairs like EUR/USD and GBP/USD as well for more potential opportunities. You can help develop your forex trading strategies using resources like IG’s Trading Academy.
Once your strategy is developed, you can follow the above steps to opening an account and getting started trading forex.
Your profit or loss is calculated according to your full position size. Leverage will magnify both your profits and losses. It’s important to manage your risks carefully as losses can exceed your deposit. Ensure you understand the risks and benefits associated with trading leveraged products before you start trading with them. Trade using money you’re comfortable losing.
How to trade USD/JPY
1. Open an account to get started, or practice on a demo account
2. Choose your forex trading platform
3. Open, monitor, and close positions on USD/JPY
Trading forex markets like USD/JPY requires an account with a forex provider like IG. Many traders watch other major forex pairs like EUR/USD and GBP/USD as well for more potential opportunities. You can help develop your forex trading strategies using resources like IG’s Trading Academy.
Once your strategy is developed, you can follow the above steps to opening an account and getting started trading forex.
Your profit or loss is calculated according to your full position size. Leverage will magnify both your profits and losses. It’s important to manage your risks carefully as losses can exceed your deposit. Ensure you understand the risks and benefits associated with trading leveraged products before you start trading with them. Trade using money you’re comfortable losing.